Cover of The Profit Leak Playbook
← Shop

The Profit Leak Playbook

Where Indian D2C brands lose money, and the arithmetic to find yours

₹1,999PDF · one-timeLaunching soon

Not on sale yet. Leave your email and we’ll send one message when it is.

Read chapter two free (PDF) ↓

127
Pages
25
Chapters
7
Worksheets
16
Figures
60
Point checklist

Seven leaks, in the order money moves

Every rupee passes through all seven between the ad click and your bank account. Each one is invisible in a platform report, and six of them are invisible in a P&L too.

01

Margin

The costs nobody has put in the model — RTO, reverse freight, COD fees, the working-capital float.
02

Discount

The largest marketing spend in most brands, and the only one that never appears in the marketing budget.

03

Store

A fifth to a third of the traffic you just paid for, dying between the product page and the payment confirmation.

04

Acquisition

Budget split so thin across so many tests that the platform never optimises and every decision is a coin flip.

05

Retention

No engine behind the second order, in a market where first-order profit needs four things right at once.

06

Signal

Paying an algorithm to buy your customers using data you have quietly degraded.

07

System

Six leaks that sit between two functions each, so they belong to nobody and surface only as a crisis.

Look inside

Two of the sixteen figures. The worksheets at the end of each part turn them into your own numbers, which is the entire method.
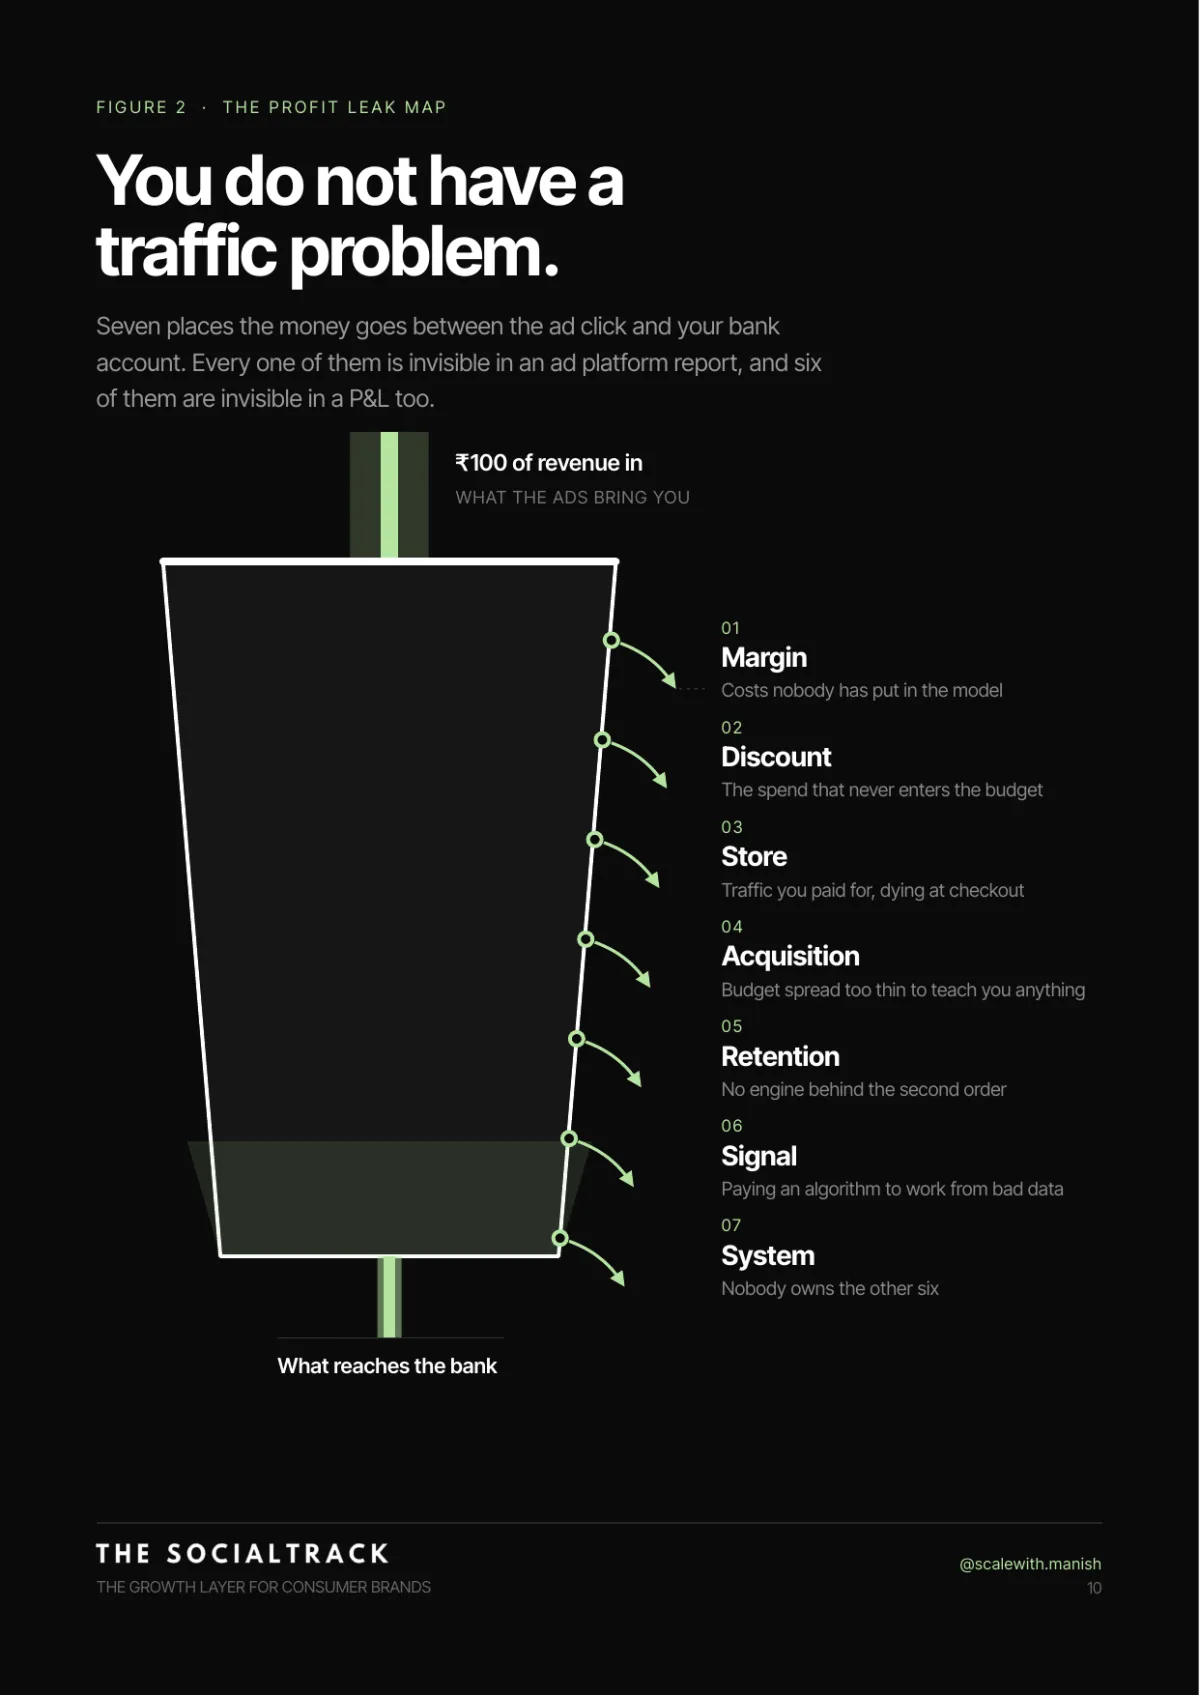
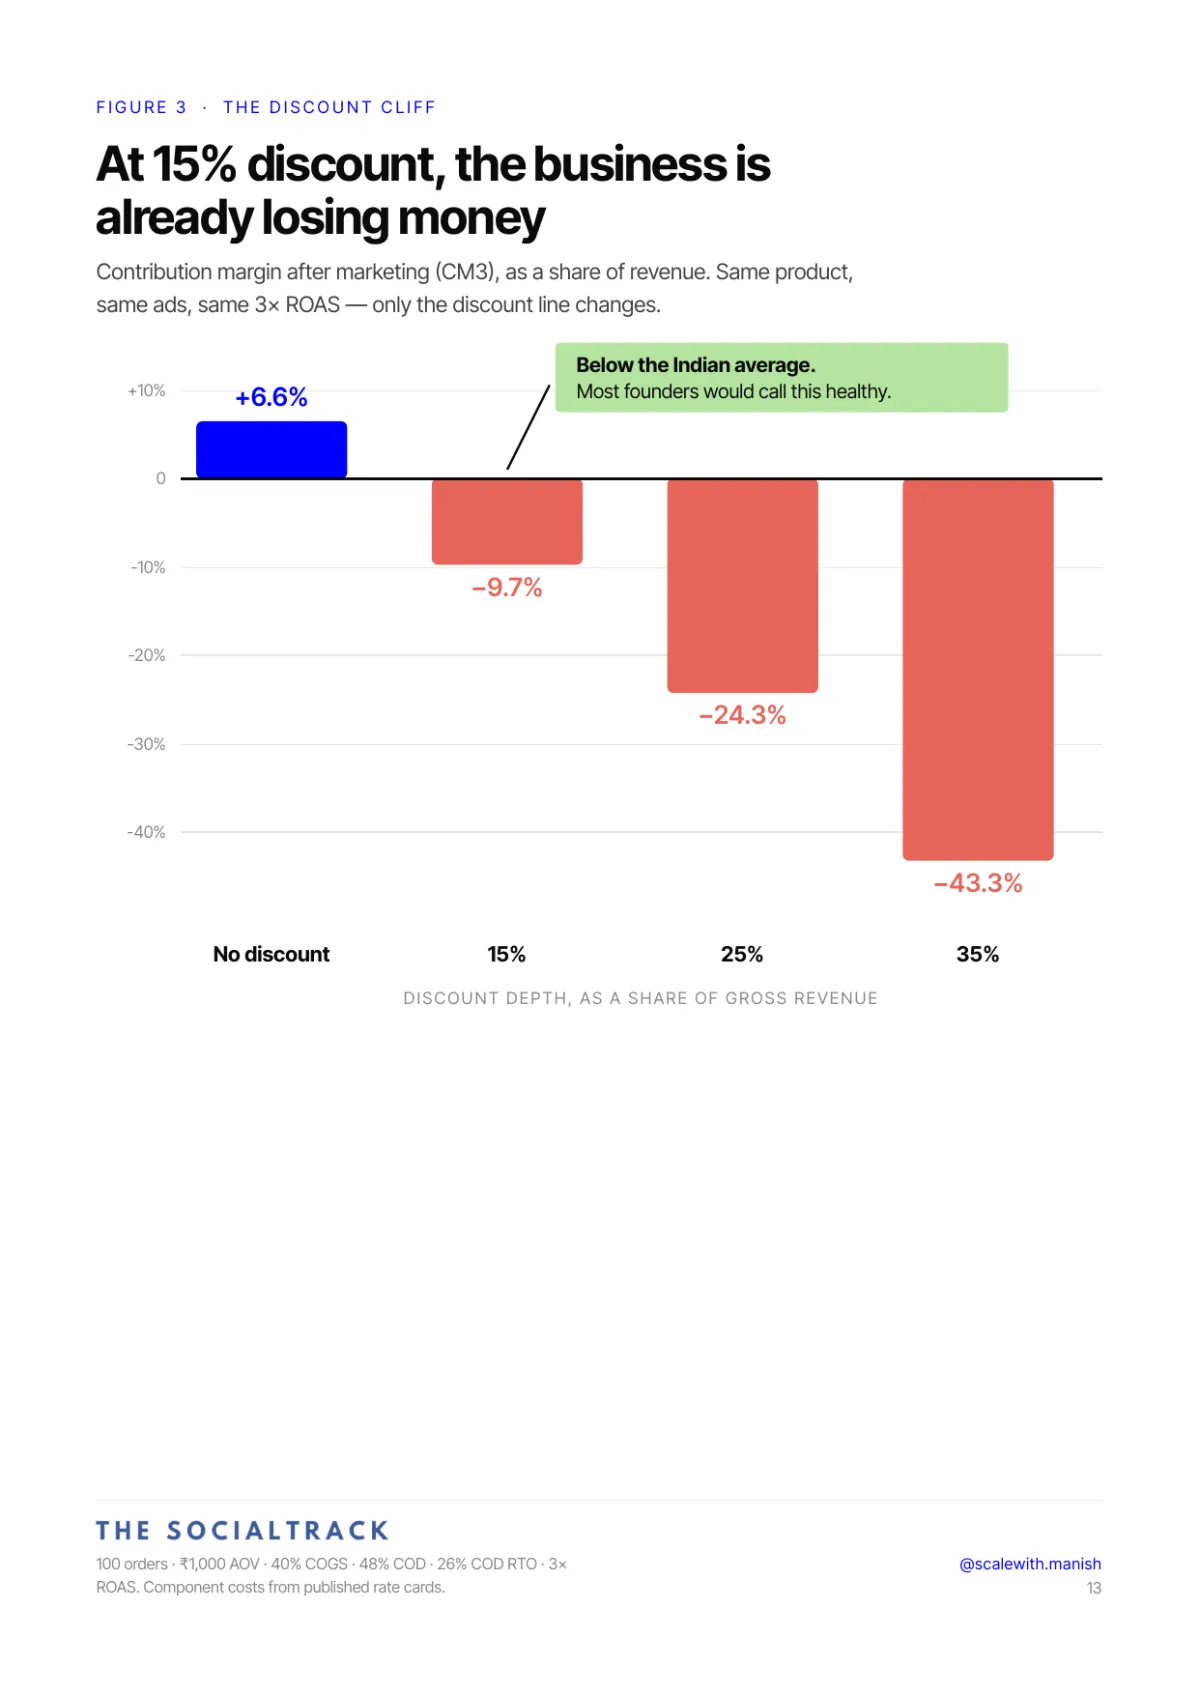
Figure 2: the profit leak map
Figure 2 · The profit leak map. Seven places the money goes between the click and the bank account.
Figure 3: the discount cliff, contribution margin against discount depth
Figure 3 · The discount cliff. Same product, same ads, same 3× ROAS — only the discount line changes.

Who it’s for

Written for you if

  • You cannot say, right now, what your contribution margin per order is — after shipping, payment fees and returns.
  • Your ROAS looks fine and your profit doesn’t, and the ad account keeps coming back clean.
  • You’ve been told this is a scale problem, and that the numbers fix themselves at ₹5 crore.
  • You’ve worked with an agency and can’t tell whether it’s working. The reports look good; the bank statement disagrees.
  • Your revenue is flat or falling while your ROAS improves — the most dangerous pattern of the five.

Not for you if

  • Pre-launch founders. The worksheets need a working store with paid traffic on it.
  • Freelancers and media buyers upskilling. This is written for whoever owns the P&L, not the ad account.
  • Agency owners after a client-acquisition playbook. There is nothing here about selling.
  • Anyone looking for growth hacks. Every chapter ends in arithmetic on your own numbers.

Contents

Twenty-five chapters, seven worksheets and four appendices, in the order money moves through a D2C business.

The thesis

  1. 01 · You do not have a traffic problem
  2. 02 · Shrinking efficiently

Leak one · Margin

  1. 03 · The number that lies
  2. 04 · Building CM1 to CM3 properly
  3. 05 · The COD tax
  4. Worksheet 1 · Your margin leak

Leak two · Discount

  1. 06 · Discount: the lever nobody manages
  2. Worksheet 2 · Your discount leak

Leak three · Store

  1. 07 · Where paid traffic dies
  2. 08 · The checkout
  3. 09 · Speed
  4. Worksheet 3 · Your store leak

Leak four · Acquisition

  1. 10 · What CPM actually measures
  2. 11 · Data density
  3. 12 · The 65% problem
  4. 13 · Reading your creative
  5. 14 · The ROAS your platform reports is not the ROAS you get
  6. Worksheet 4 · Your acquisition leak

Leak five · Retention

  1. 15 · The second order problem
  2. 16 · Flows beat campaigns, and cohorts beat both
  3. 17 · WhatsApp economics
  4. Worksheet 5 · Your retention leak

Leak six · Signal

  1. 18 · The leak inside the pixel
  2. Worksheet 6 · Your signal leak

Leak seven · System

  1. 19 · The founder is usually the bottleneck
  2. 20 · The twelve metrics that actually move money
  3. 21 · Where AI actually helps in 2026
  4. Worksheet 7 · Your system leak

Putting it together

  1. 22 · Your leak map, ranked
  2. 23 · Score your account
  3. 24 · The next ninety days
  4. 25 · The one thing

Appendices

  1. A · The 60-point checklist
  2. B · What has no credible published data for India
  3. C · Formula reference
  4. D · Sources

Who wrote it

Manish Rai has spent twelve years in performance marketing and D2C growth, in-house and consulting. He was Performance Head at boAt, running the D2C growth engine at India’s largest audio brand, and now runs The Social Track as an embedded growth function inside consumer brands — acquisition, retention, merchandising and unit economics as one job rather than five.

The book is written from those accounts. Client figures are anonymised and come from each brand’s own backend reporting rather than a platform dashboard, and every one is labelled as a single business rather than a benchmark.

₹55 Cr+
Media managed
18 lakh+
Orders delivered
25+
Brands
12
Categories

Frequently asked questions

What do I need before I start reading?

Twelve numbers from your last complete month: sessions, add to carts, checkouts initiated, orders, gross revenue, total discount value, AOV, COD share, RTO rate, 90-day repeat rate, plus your ad spend and live ad set count. If you cannot produce the discount, RTO or repeat figure, that is itself a finding — three chapters are about exactly those.

Is this specific to India, or a global playbook with rupee signs?

Specific. COD and return-to-origin economics, UPI’s zero merchant discount rate, WhatsApp template pricing and the payment-mix maths are the spine of the book. Where no credible India-specific dataset exists, global figures are used and labelled as global rather than dressed up as local.

Where do the numbers come from?

Every figure carries a grade next to it: [A] audited filings, platform documentation or peer-reviewed research; [B] real data from a company with something to sell; [C] commonly cited with no traceable source; [OWN] from engagements the author ran, always labelled as a sample of one business. Appendix B lists the eleven places where no credible published number exists, rather than inventing one.

Is there a free sample?

Yes. Chapter two, “Shrinking efficiently”, is the full chapter as a PDF — the pattern where revenue falls while ROAS improves, and a five-month engagement where discount depth went from 45% to 16% and revenue went up 4.9×.

When does it launch, and what happens if I join the waitlist?

It is being finished now, so there is no public date yet. Join the waitlist and you get one email when it goes on sale — nothing else, and you can unsubscribe from it.